Everything the panel can do.
Four tabs, a data explorer, and a set of controls for poking at the cache while you debug. Every screenshot below is captured from the real panel running against the demo app, not a mockup, so what you see here is what you get.
Every cache entry, with its real status
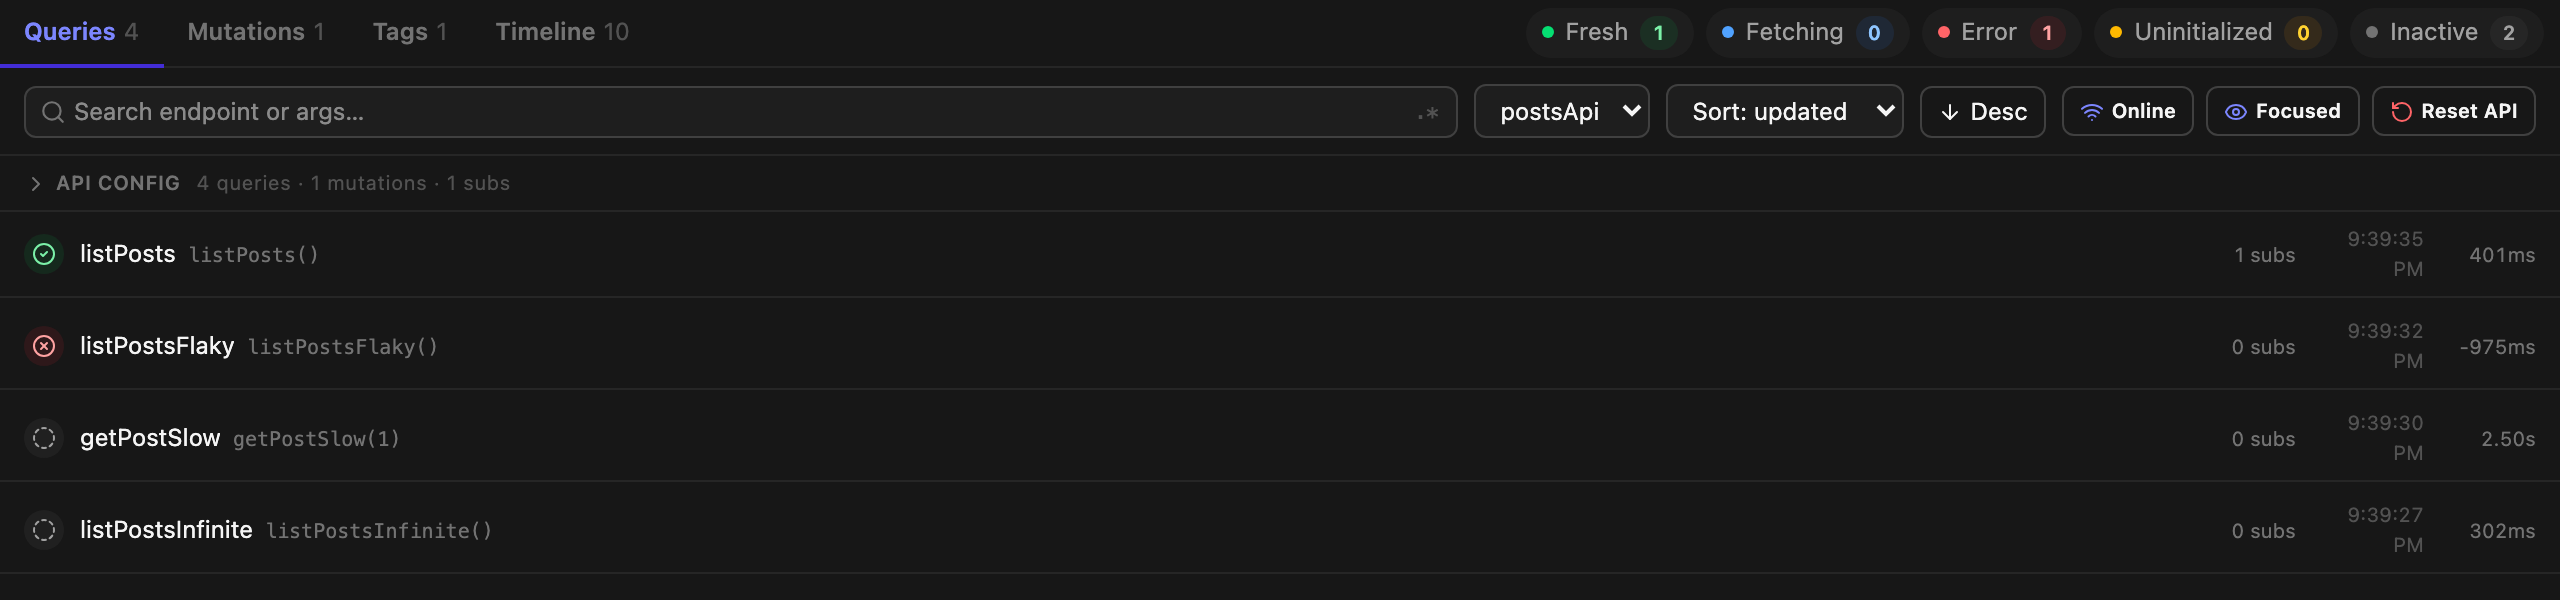
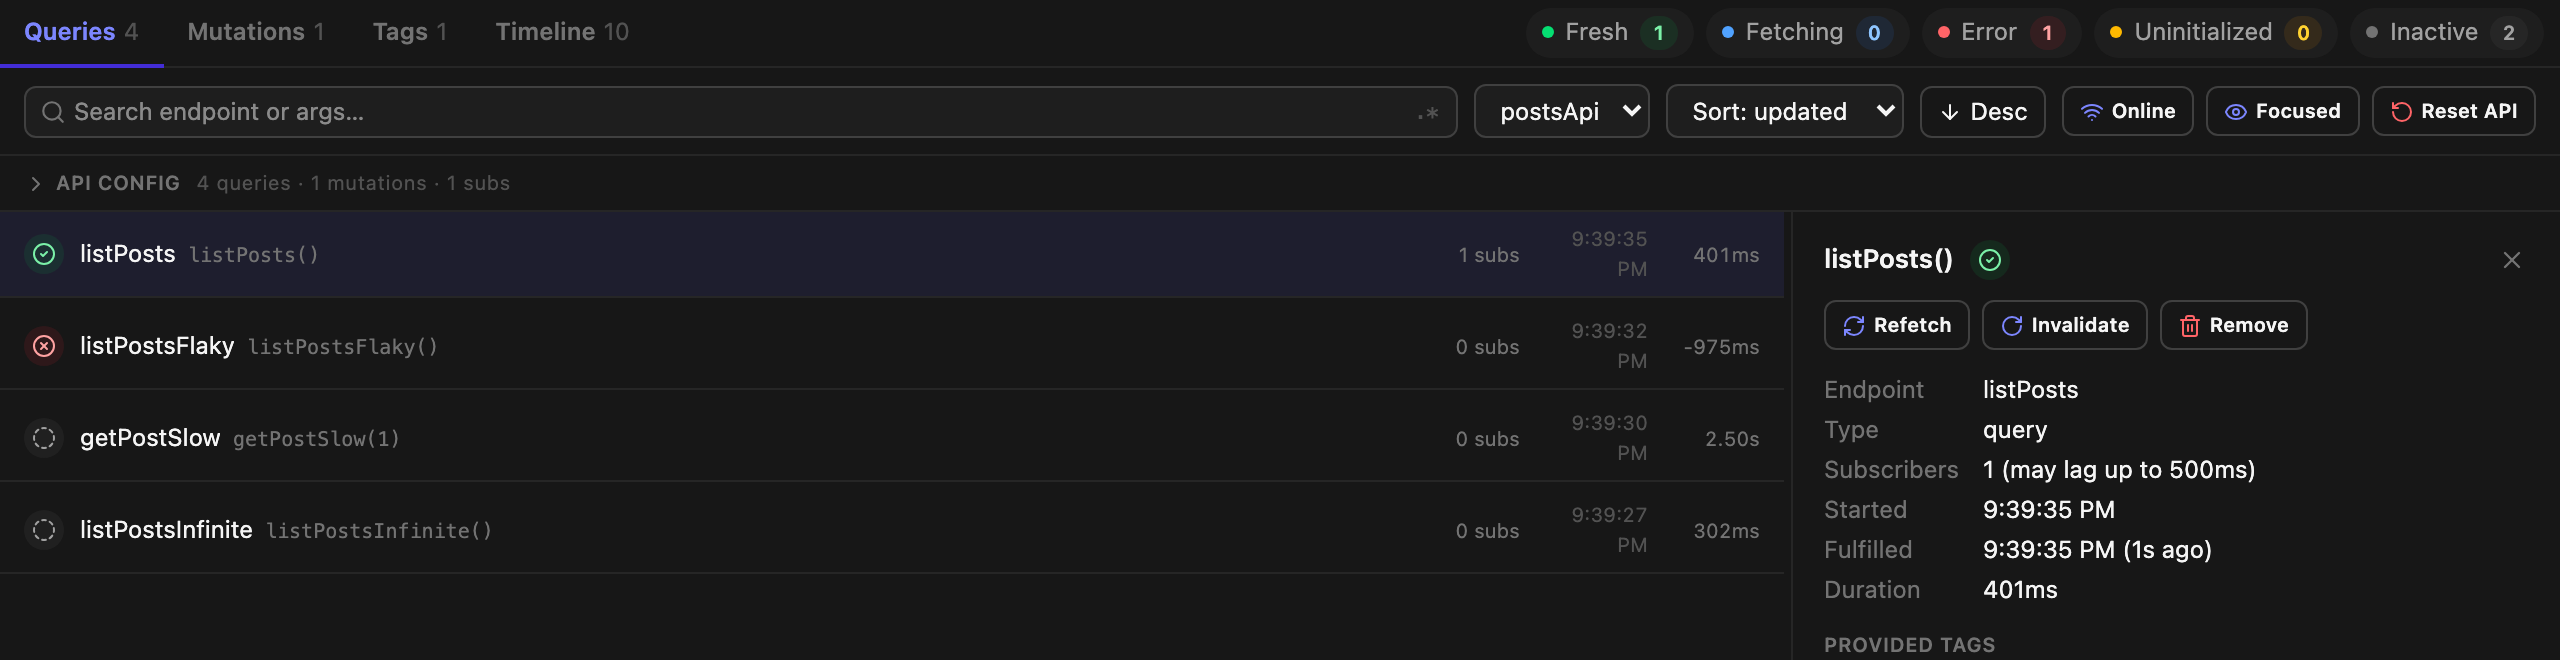
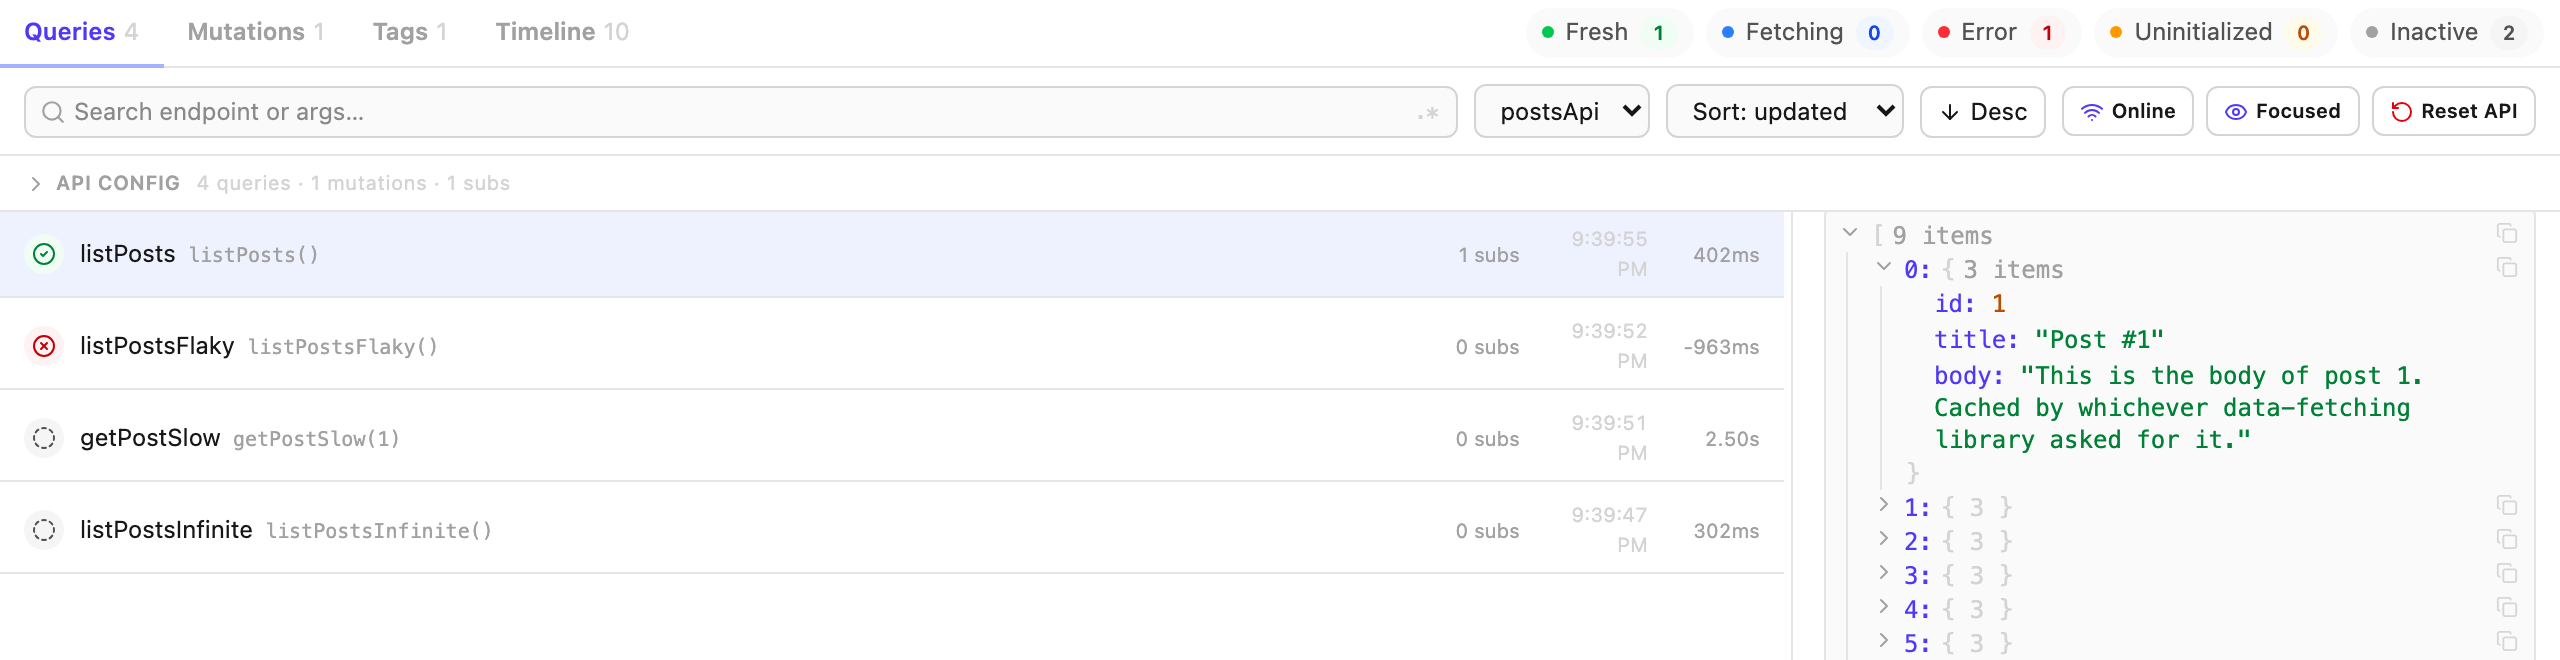
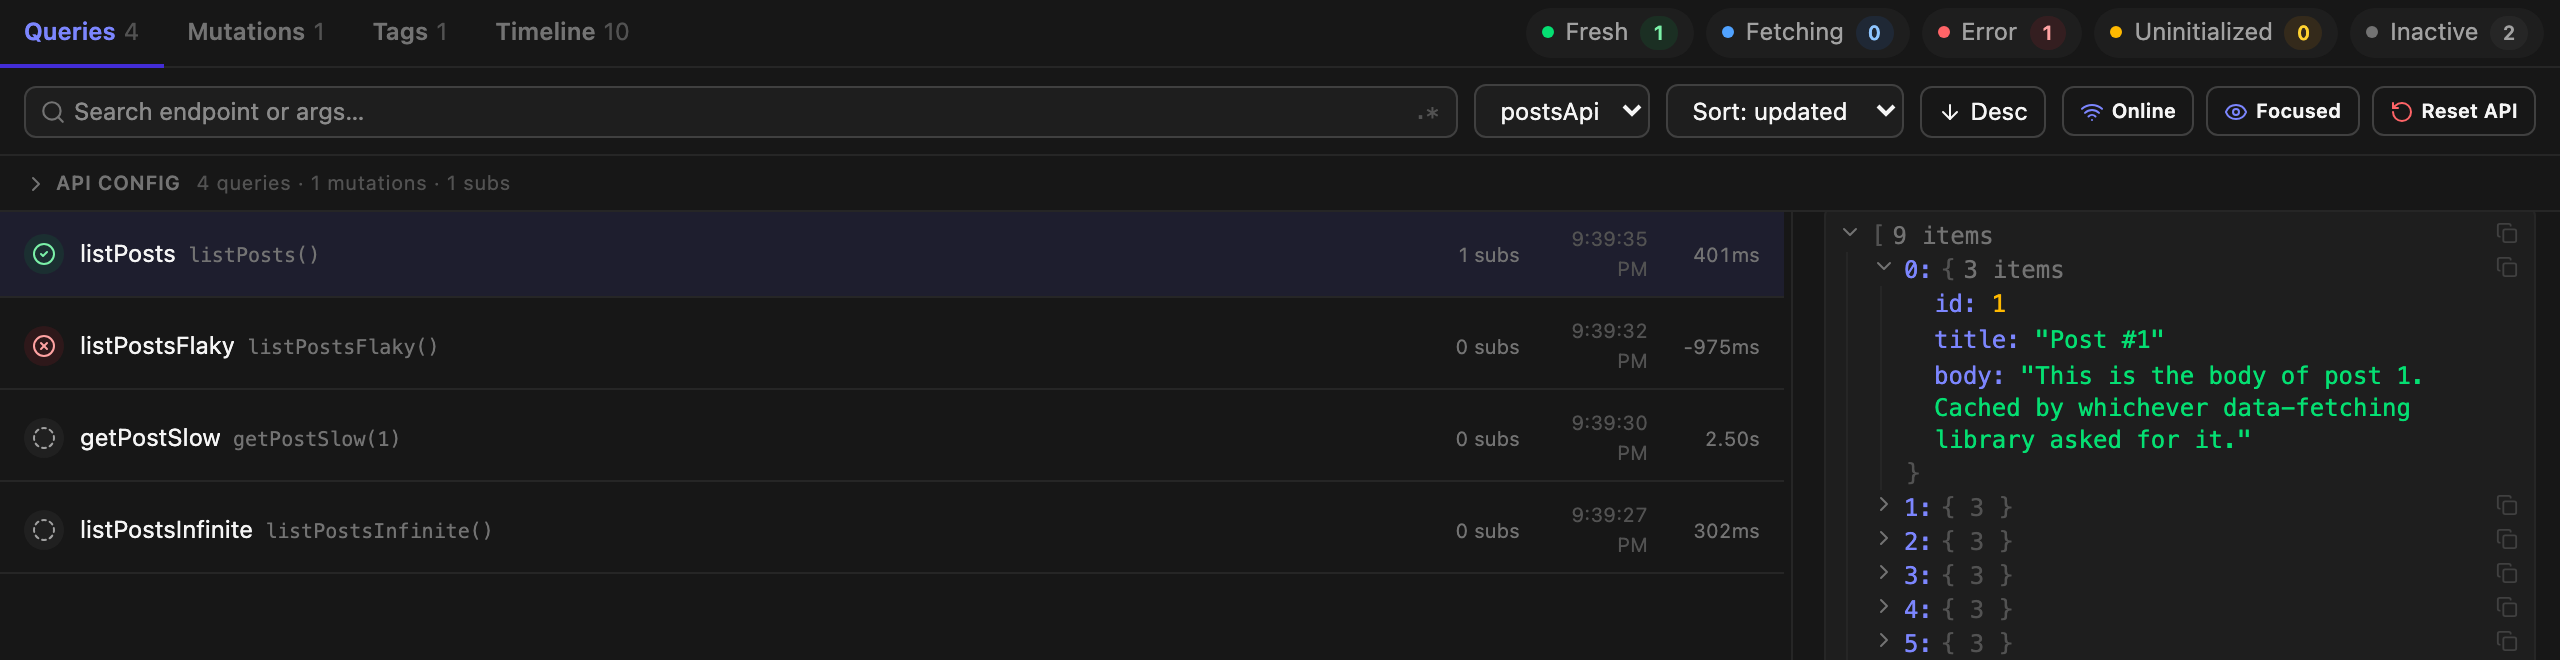
The default tab. One row per cache entry, updated live as your app runs.
Status at a glance
Each entry gets a derived status:
fresh, fetching, error, inactive, or uninitialized, colour-coded, with the endpoint name, the serialized cache key, subscriber count, and when it last updated. There is deliberately no stale badge: RTK Query has no staleness model, it evicts via keepUnusedDataFor. An entry that is fulfilled with zero subscribers reads as inactive, which is the state that actually matters, because it's about to be collected.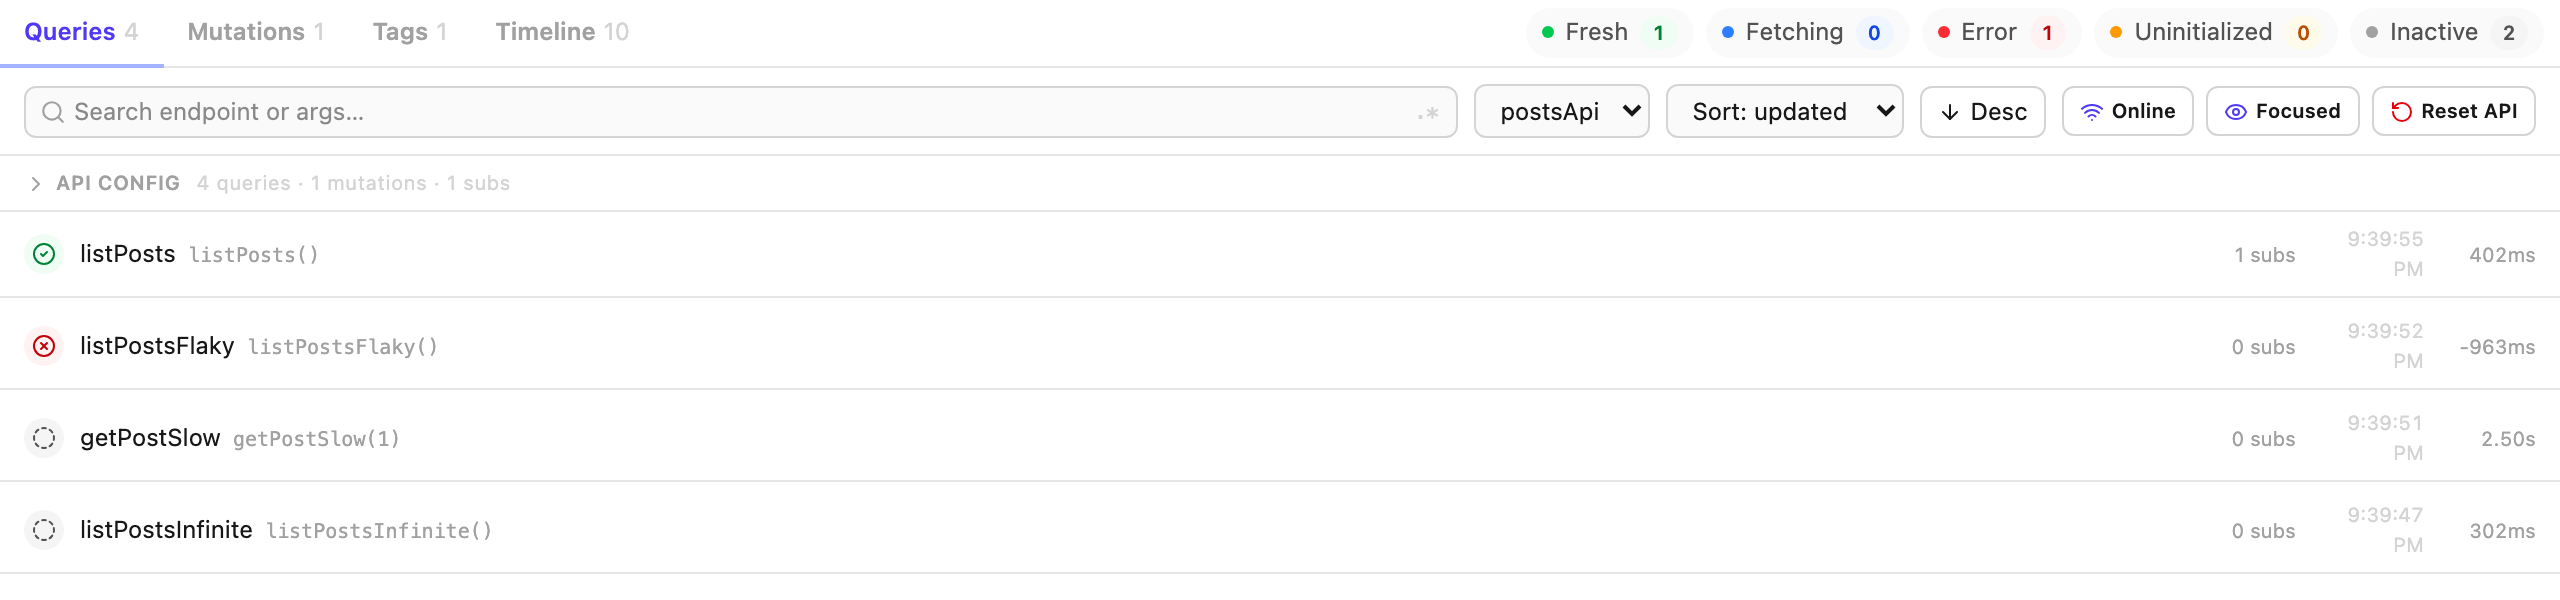
Filter by status
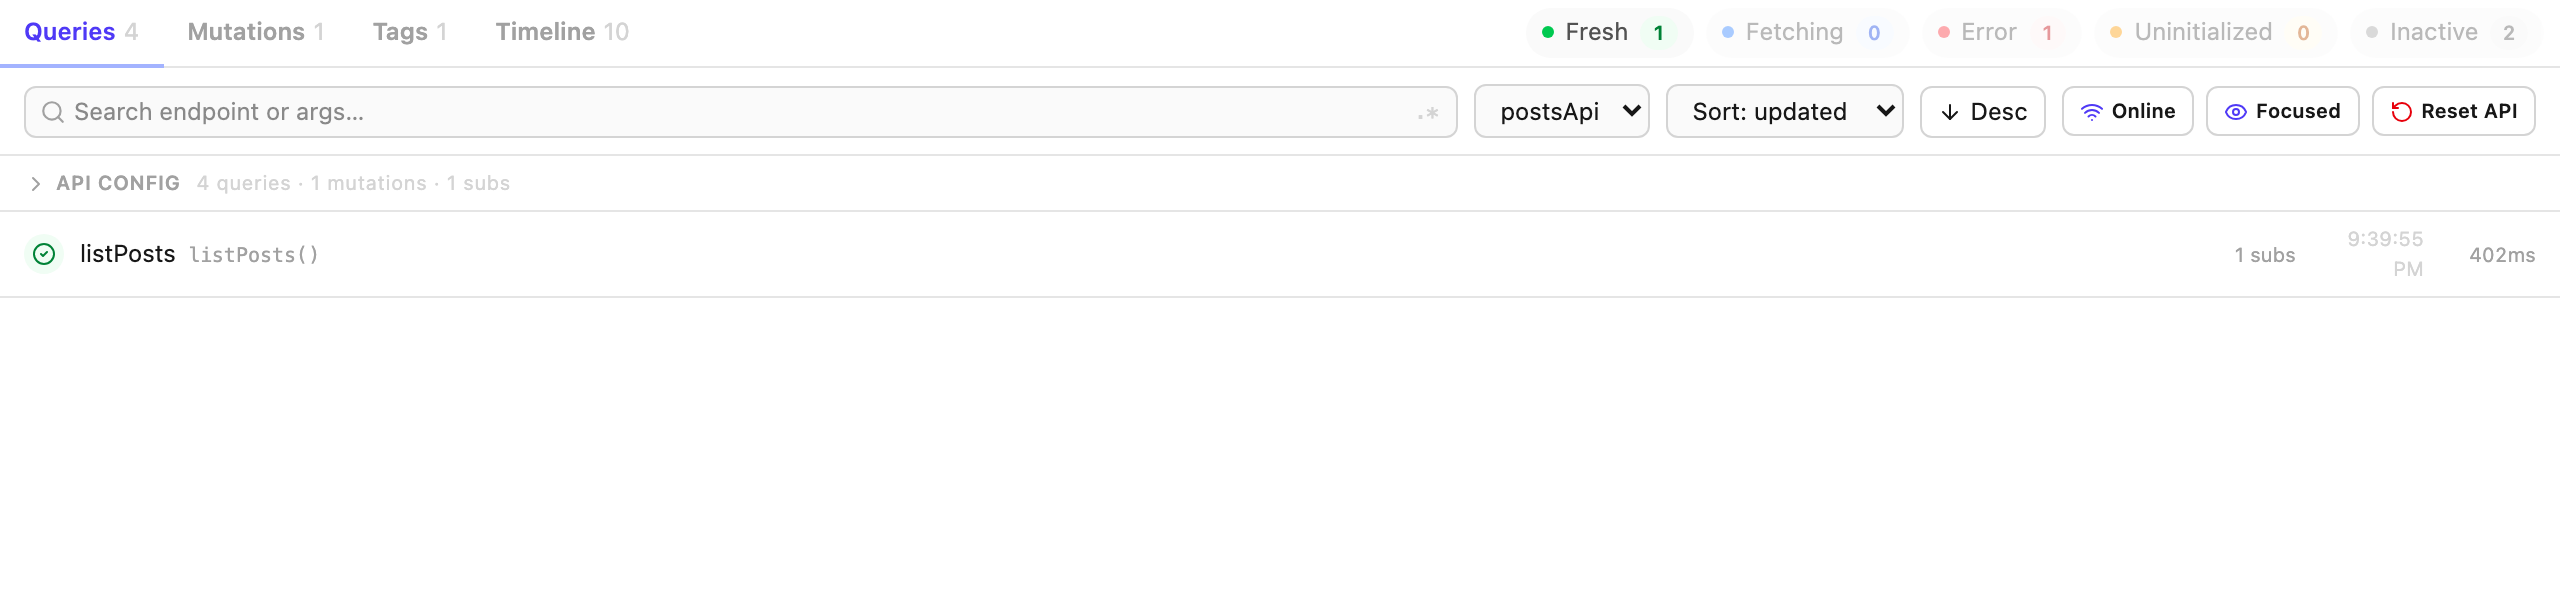
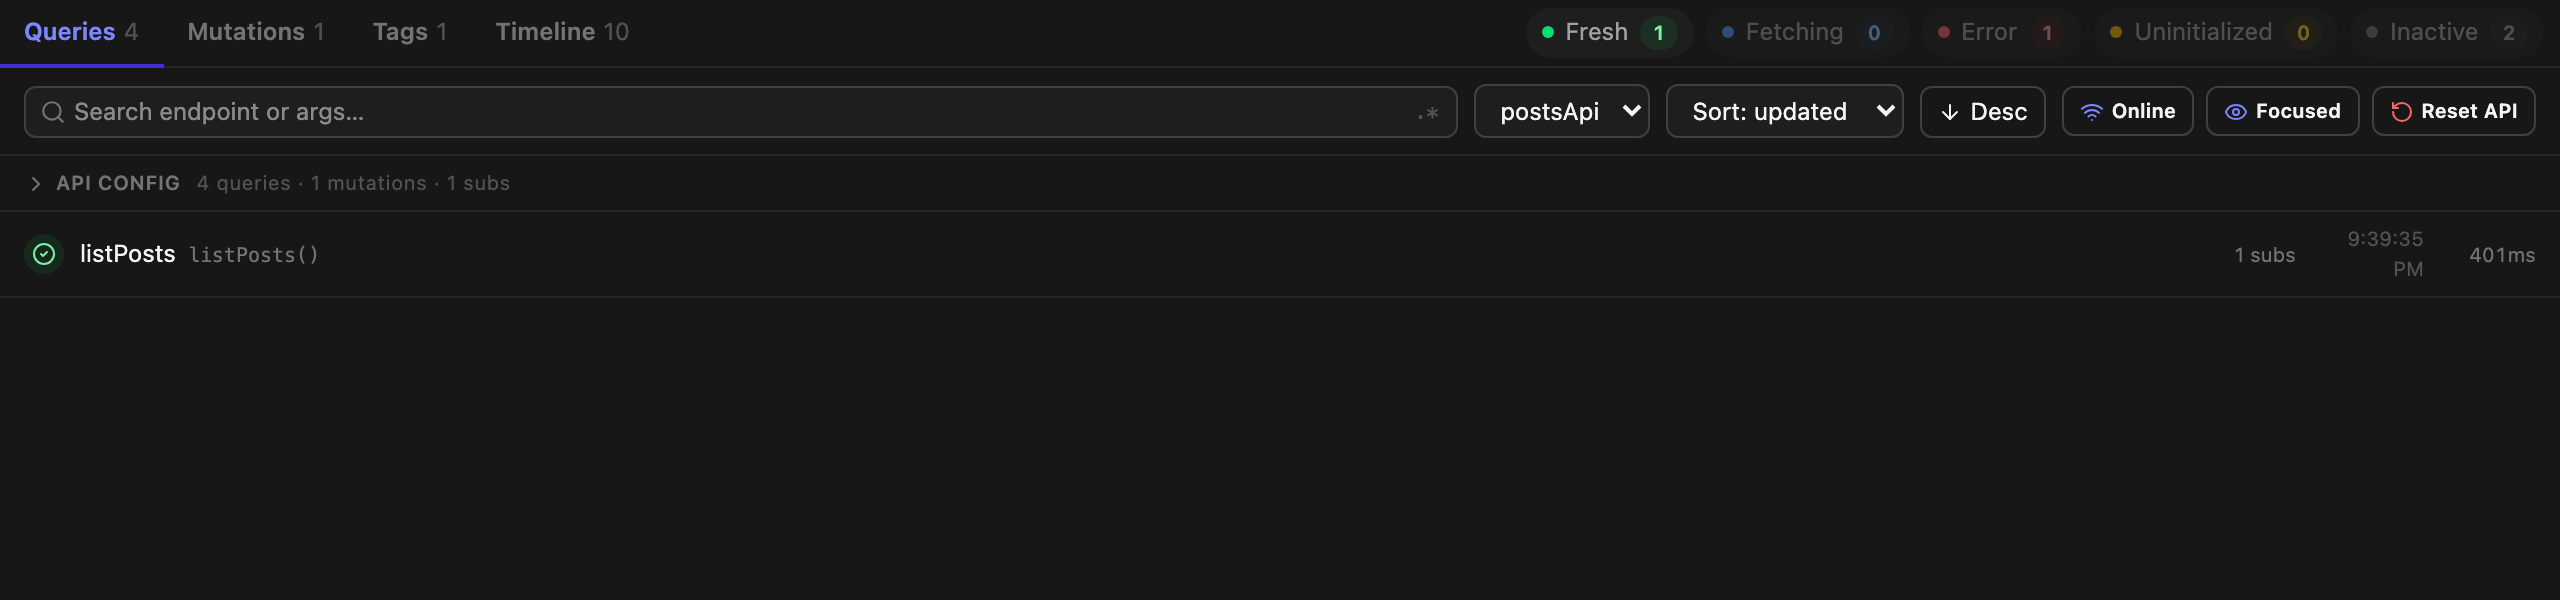
The counts in the header are also the filter. Click any status to narrow the list; unselected pills dim so it's obvious a filter is on. They collapse to dots and counts when the panel is narrow.
Fuzzy search, or a regular expression
Search is fuzzy by default, so
lpf finds listPostsFlaky. Toggle .* for regular expressions when you need precision. A pattern that doesn't compile leaves the list unfiltered and marks the toggle instead of blanking the panel while you're mid-keystroke.

Sort, in either direction
Order by last updated, endpoint name, or status severity, ascending or descending. The default, most recently updated first, is usually what you want when something just changed.
The detail pane
Select an entry for its endpoint, type (
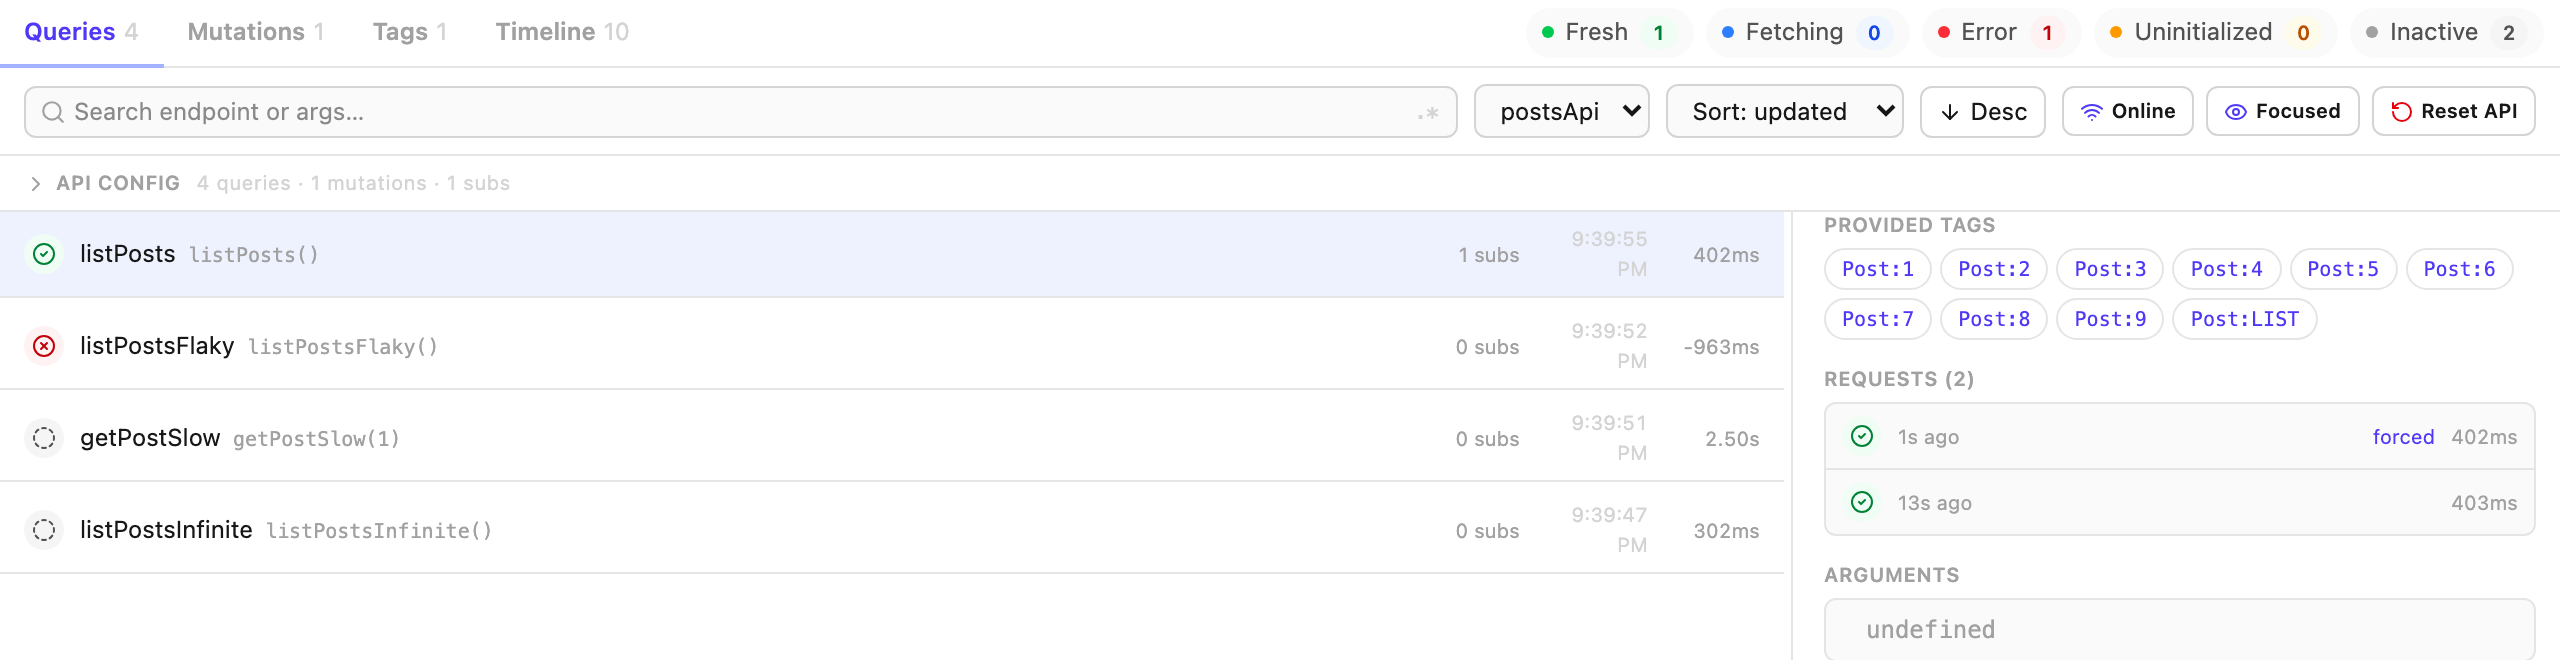
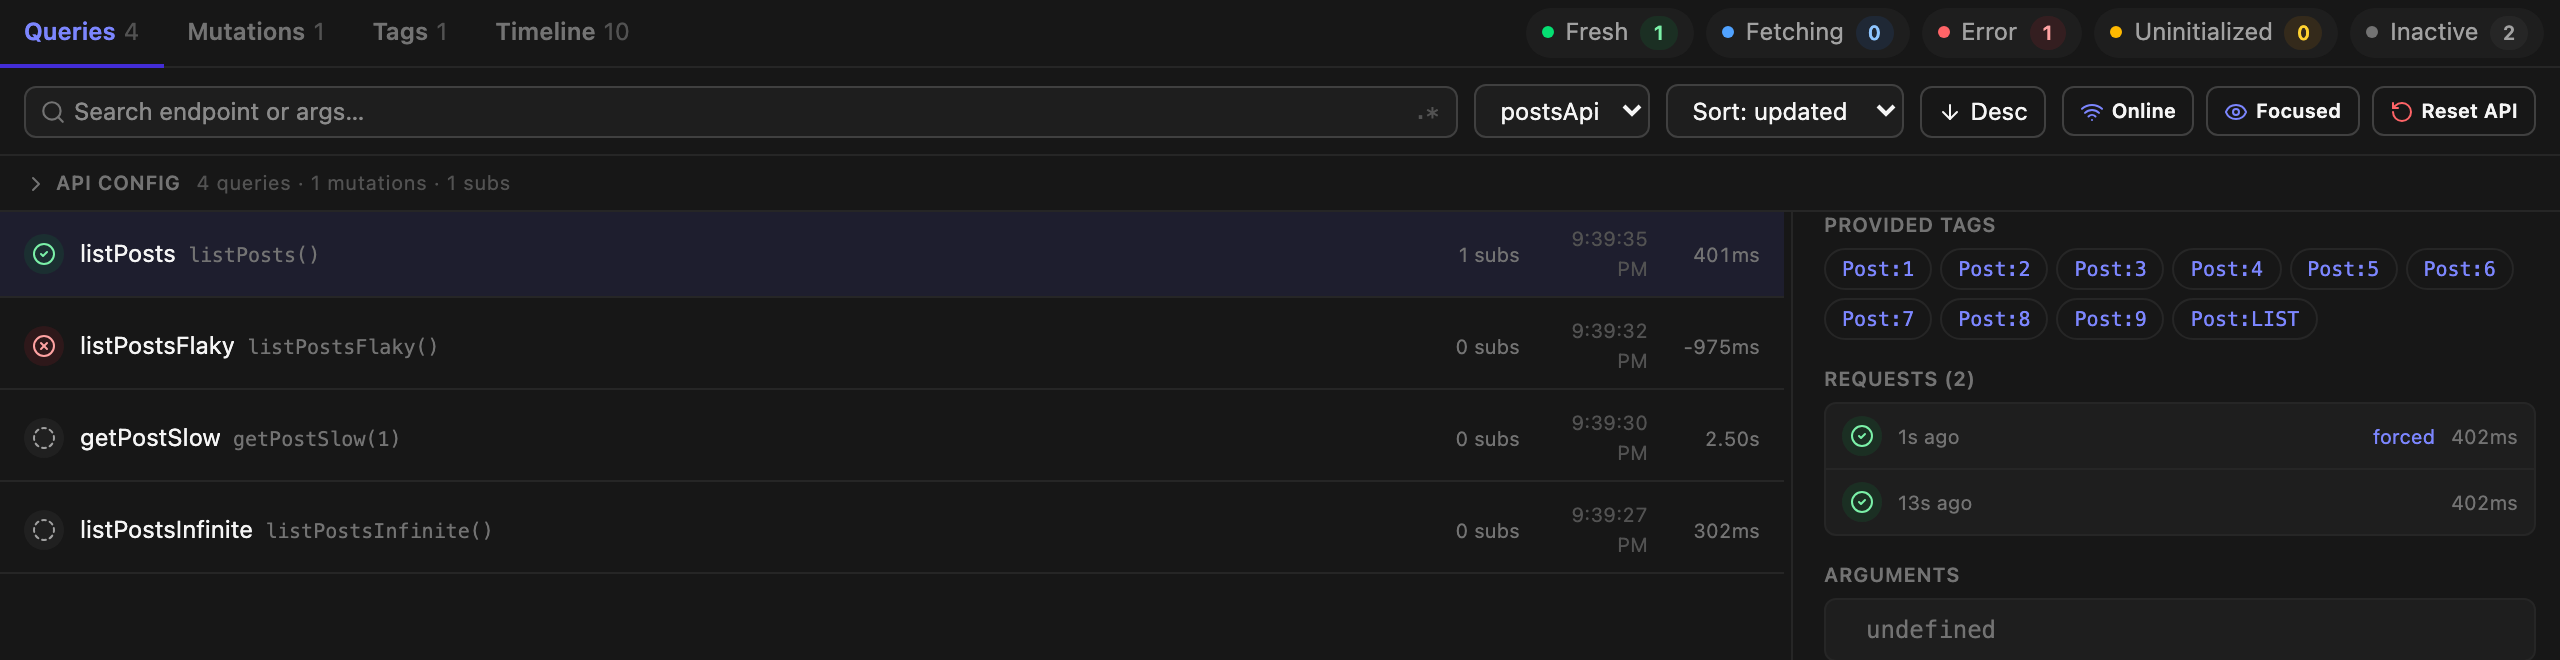
query or infinitequery), subscriber count, timings, and duration. Provided tags render as chips that jump straight to the Tags tab. Subscriber counts carry a note that they can lag ~500ms: that's RTK Query syncing subscriptions on a throttled timer, not a bug in the panel.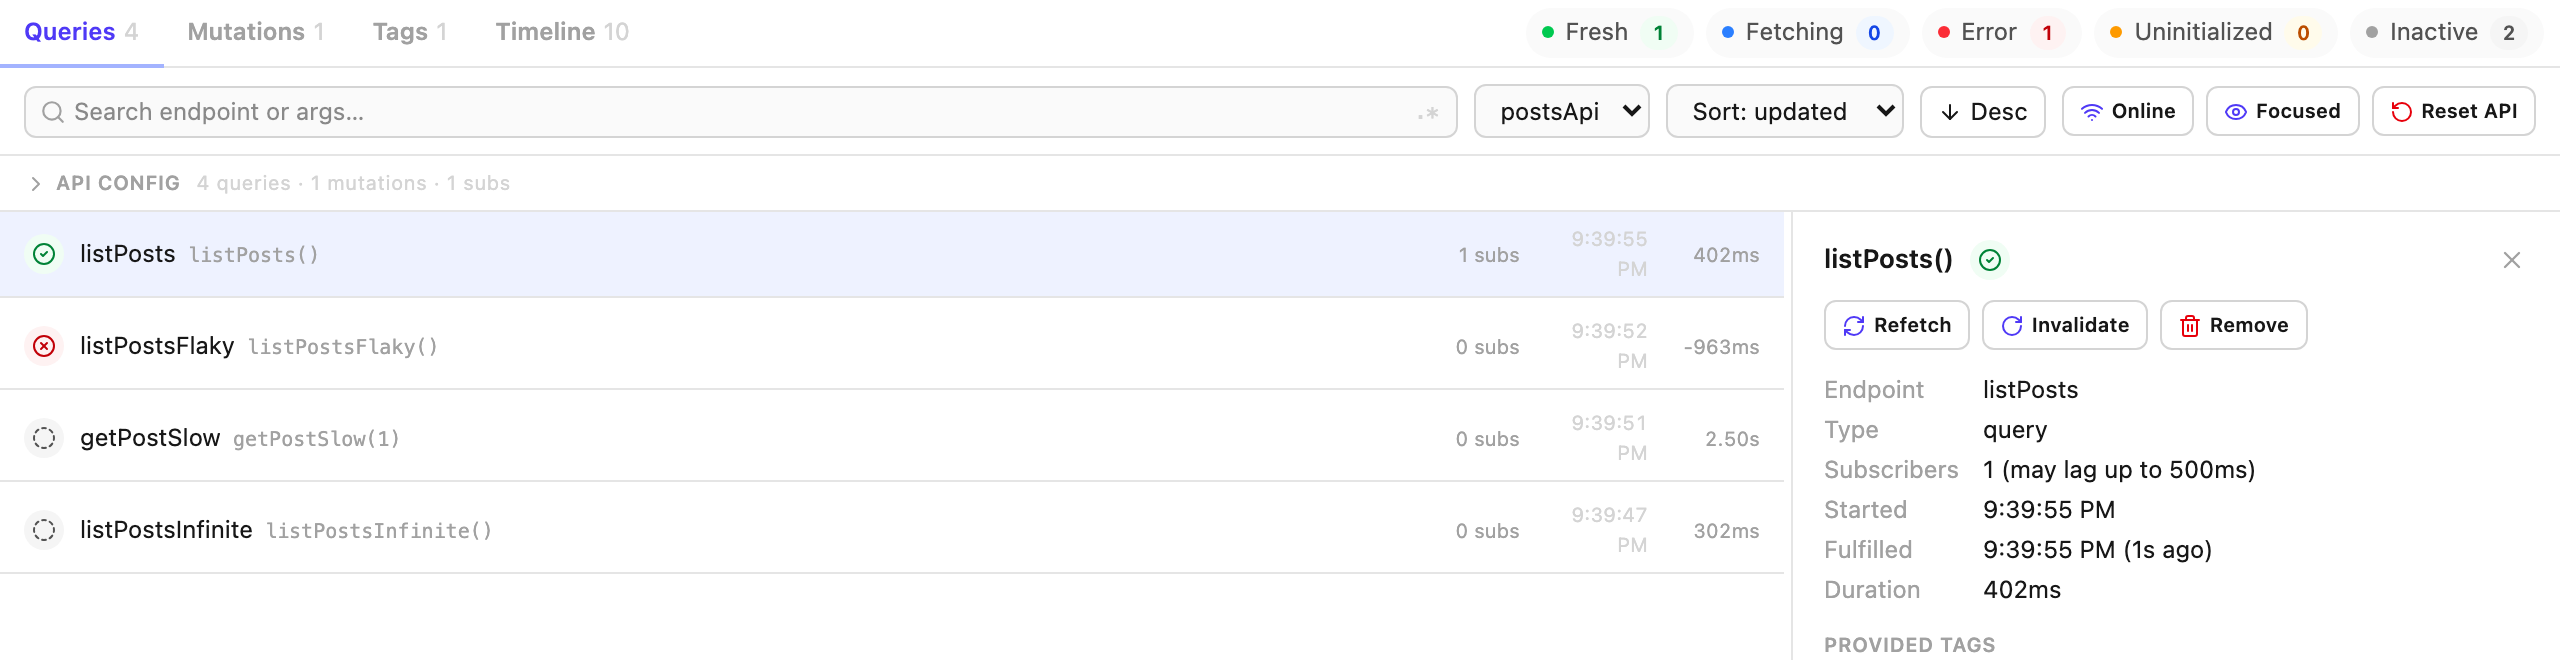
Full request history per entry
A cache entry only remembers its latest request. This lists every request that targeted it: each refetch, its outcome, duration, and whether it was forced. It's how you answer "has this refetched, how often, and did any of them fail?"
Act on the cache
Refetch forces a fresh request. Invalidate invalidates everything the entry provides. Remove drops it. Reset API clears the whole cache, behind a confirmation. Refetch needs the real api object, so it's disabled with an explanation if you didn't pass apis.Read your cached data without hanging the panel
Used everywhere a value is shown: arguments, data, errors, and the raw entry.
Collapsible, copyable, lazy
The tree never serializes a whole value up front, which is the usual way a devtool freezes on a large cache. Every node has a copy button that serializes on demand. Large collections split into chunks of 100 rather than rendering fifty thousand rows.
Handles what real data actually contains
Map, Set, BigInt, Date, functions, symbols and circular references all render sensibly. Error instances show name, message and stack. Without that they'd appear as an empty {}, since those fields aren't enumerable.The raw entry, when the summary isn't enough
Each detail pane ends with the complete derived entry, so nothing is hidden behind the curated rows above it, including the true cache key, raw status, and request id.
What you sent, and what came back
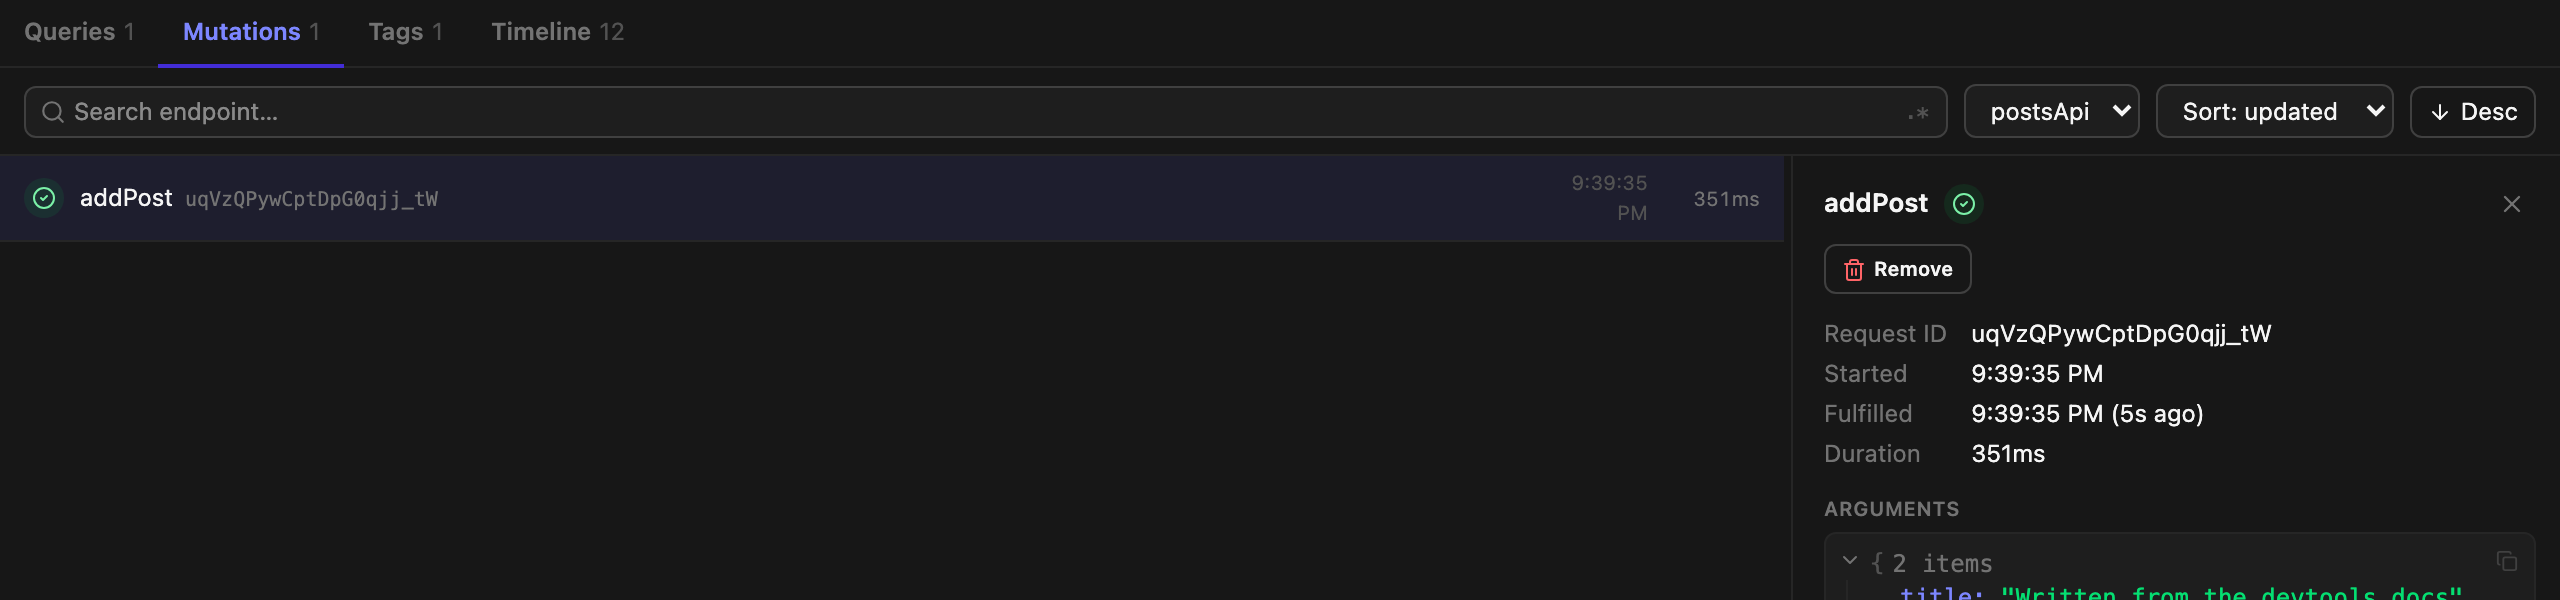
Keyed by request id, or by your fixedCacheKey when you set one.
Including the arguments
RTK Query doesn't keep mutation arguments in state, so the panel recovers them by correlating against the timeline. You get the arguments, the result or error, timings, duration, and a
Remove action. Same search and sort controls as Queries.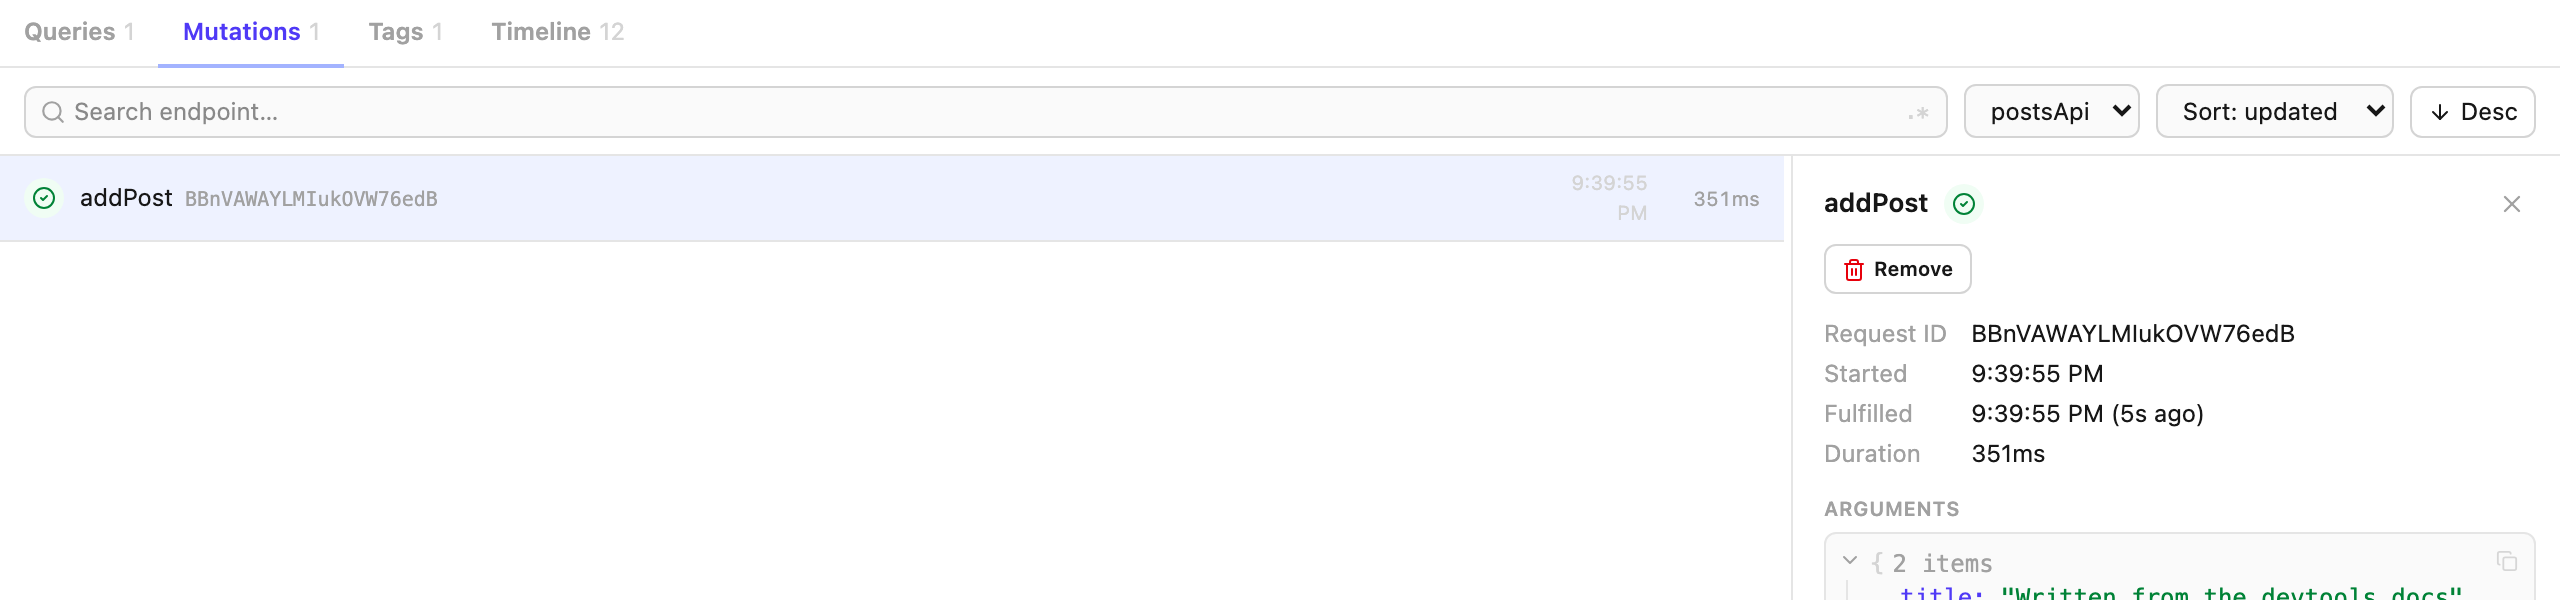
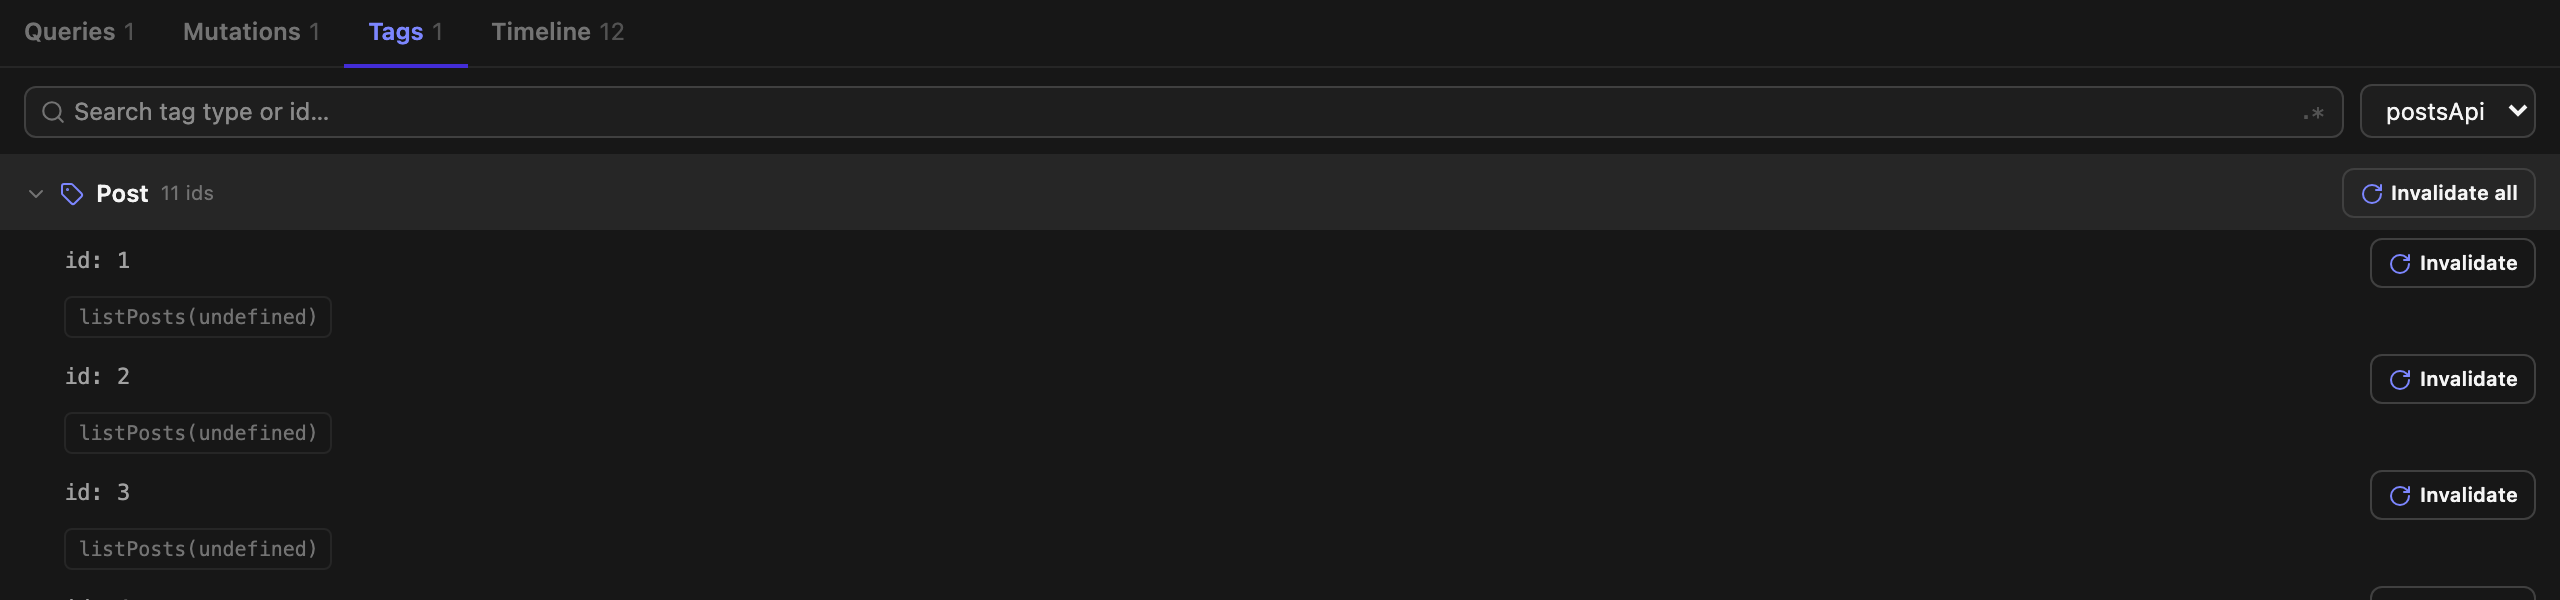
Which tags exist, and what they'd invalidate
The invalidation graph RTK Query maintains internally, made visible.
Grouped by type, expandable to cache keys
Tags group by type, then by id, and expand to the exact cache entries each one touches. Click a cache key to jump to it in Queries. Invalidate a single id or the whole type from here. Tags provided without an id show as
none rather than RTK's internal sentinel.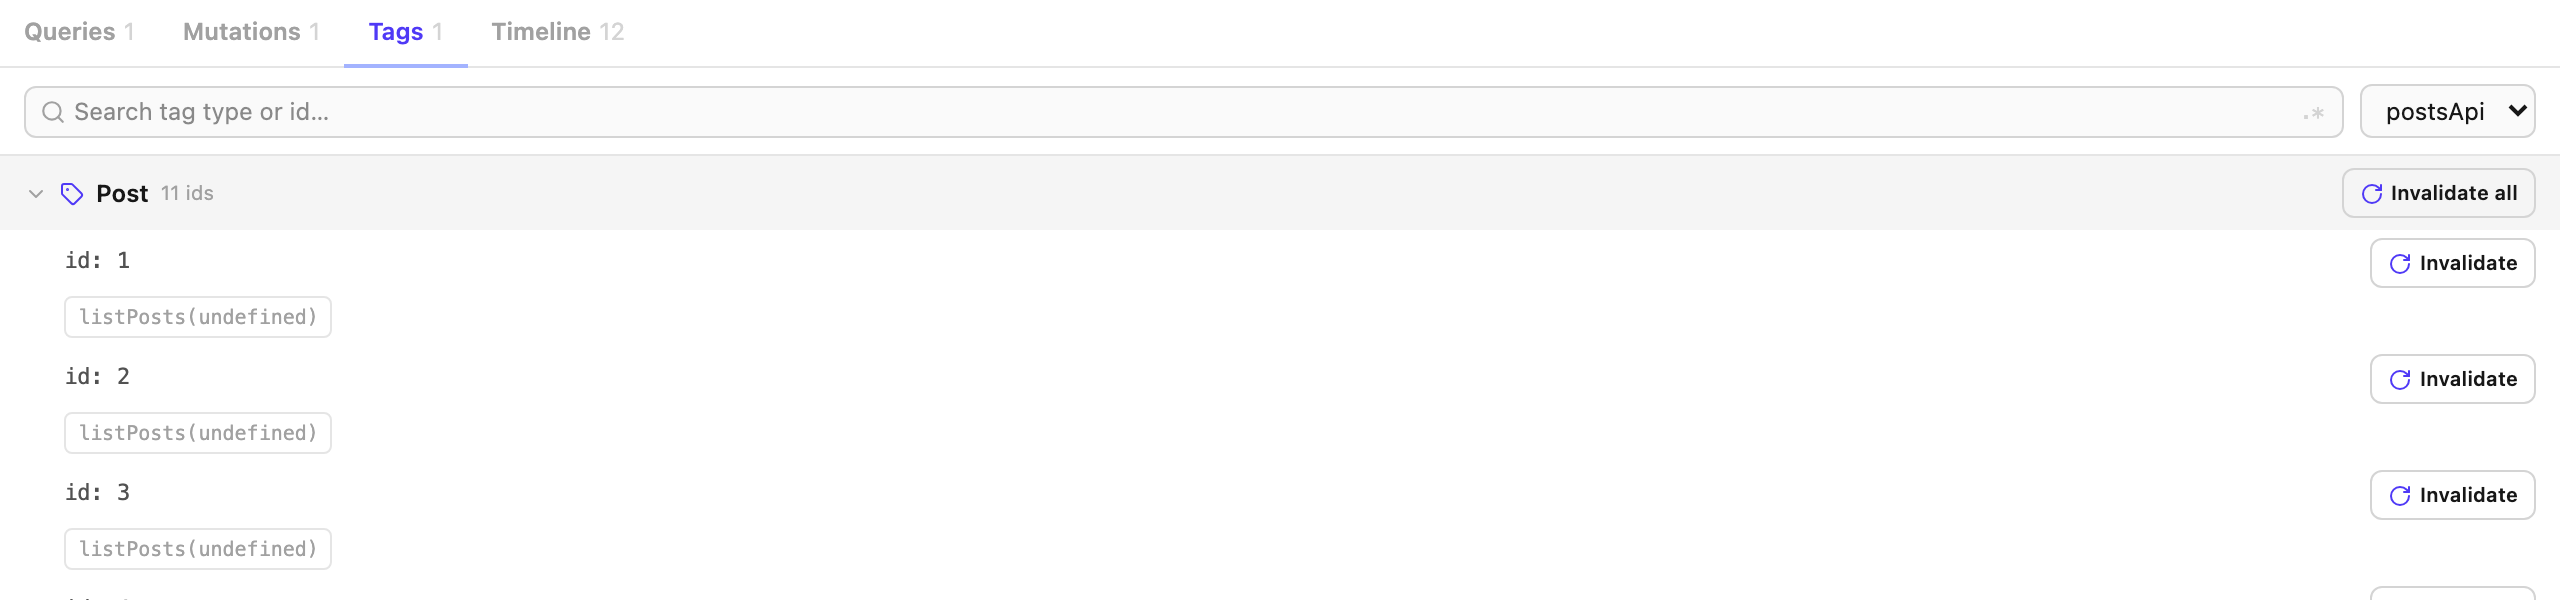
A network tab for your cache
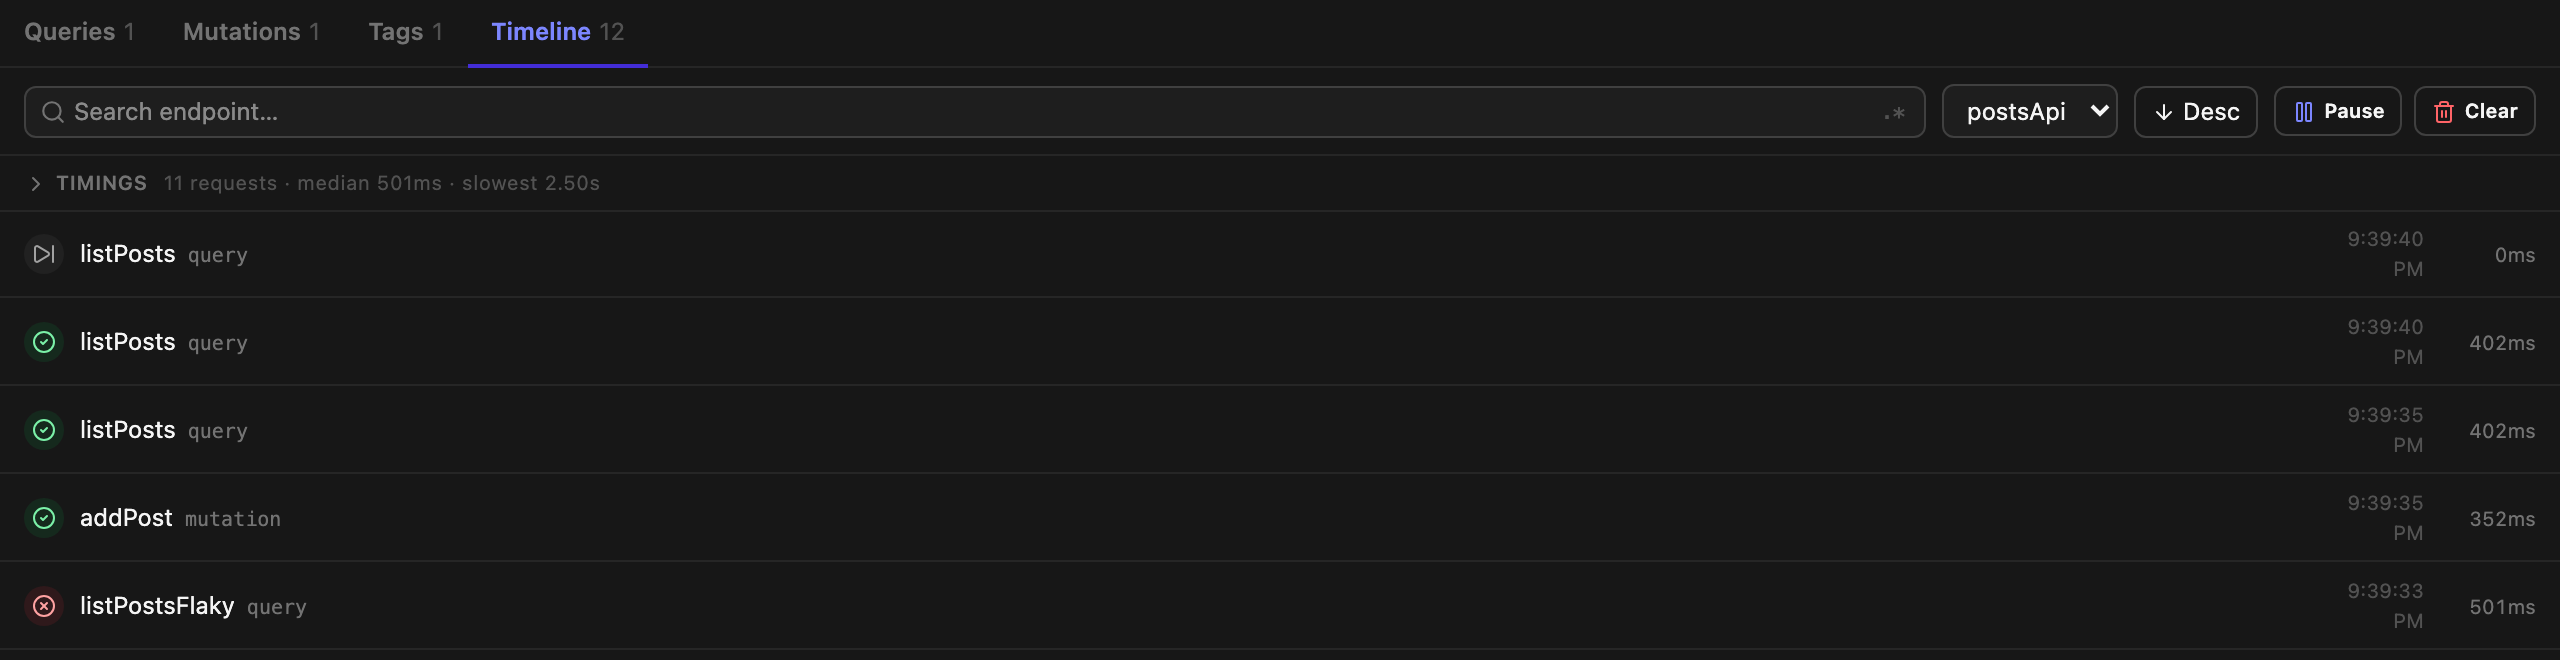
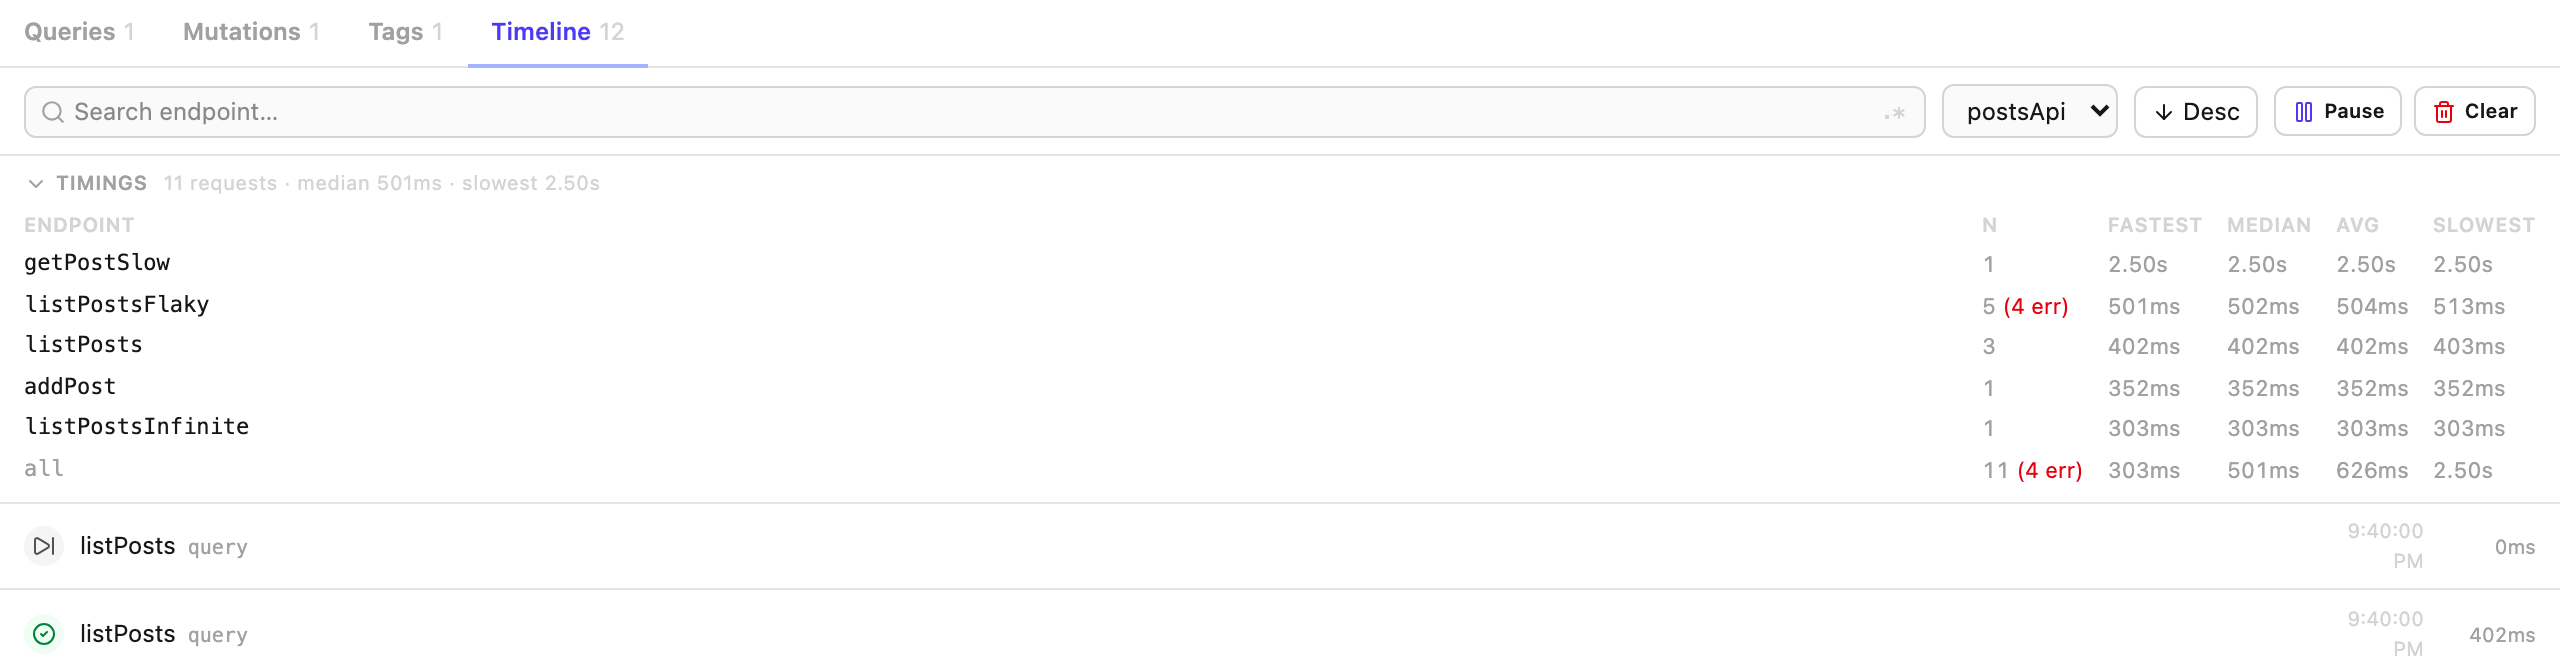
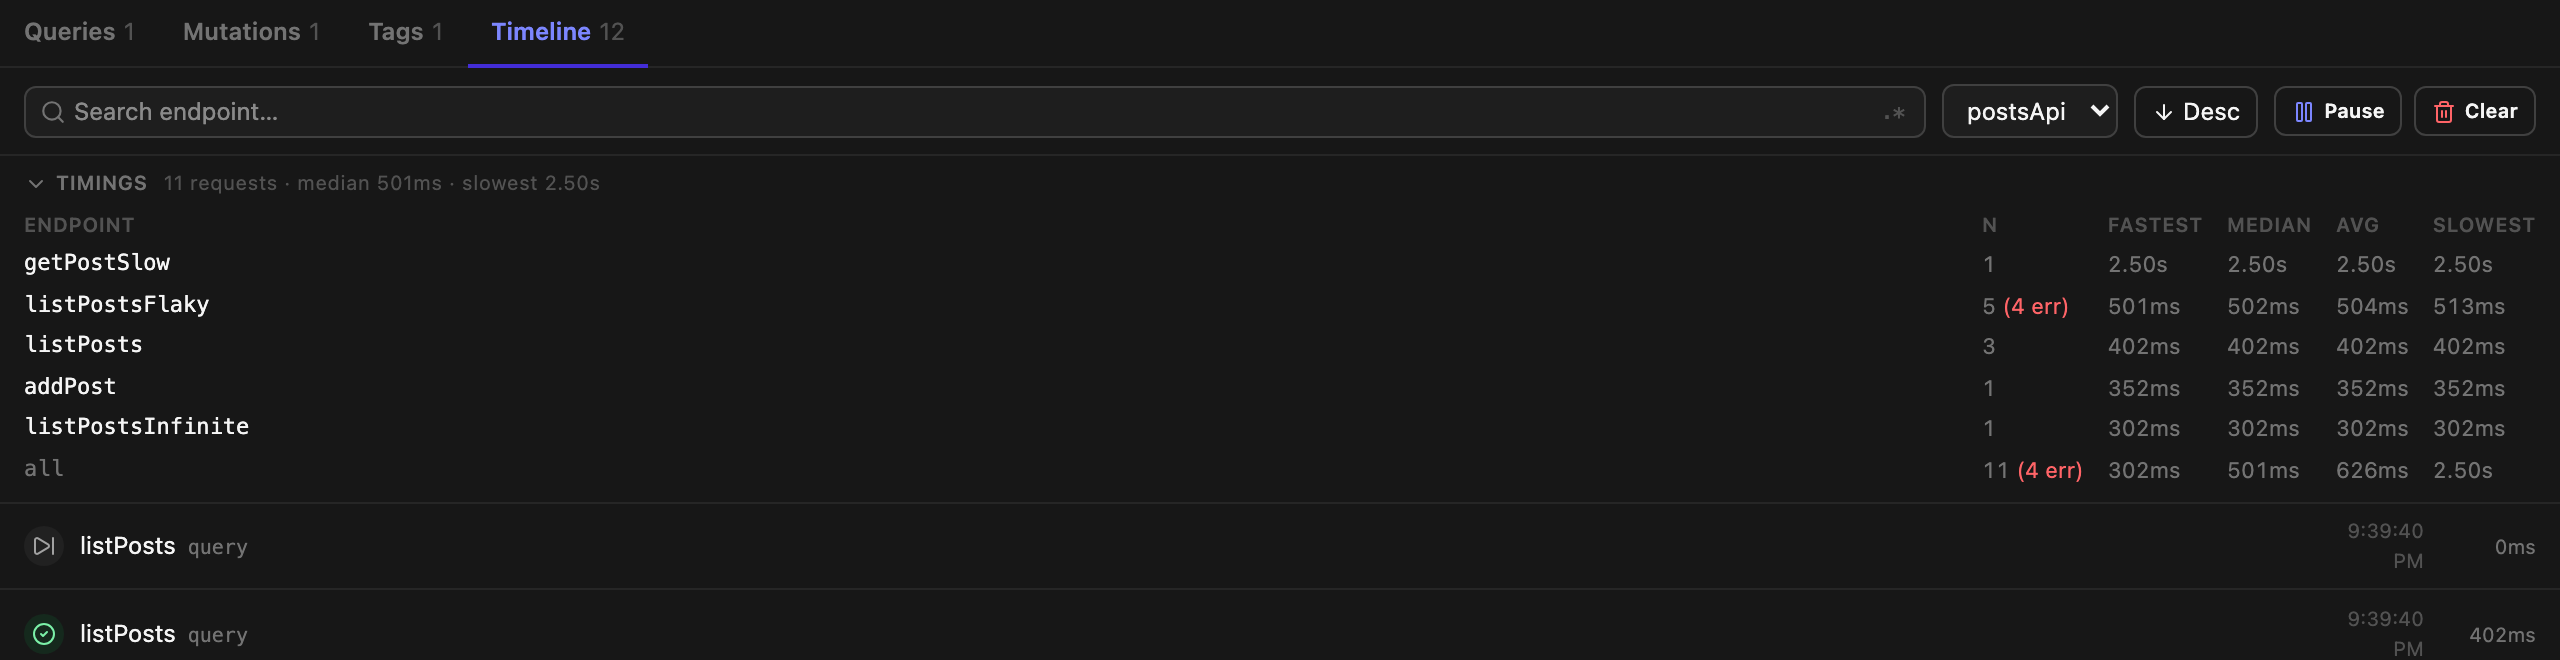
Every query and mutation lifecycle, in order, with timings.
The event log
Each entry shows the endpoint, whether it was a query, mutation or infinite query, its outcome and how long it took. Deduped requests are marked
skipped rather than counted as failures. Pause capture when you want a stable view, or clear it. The buffer holds the last 500 events by default, configurable via maxTimelineEntries.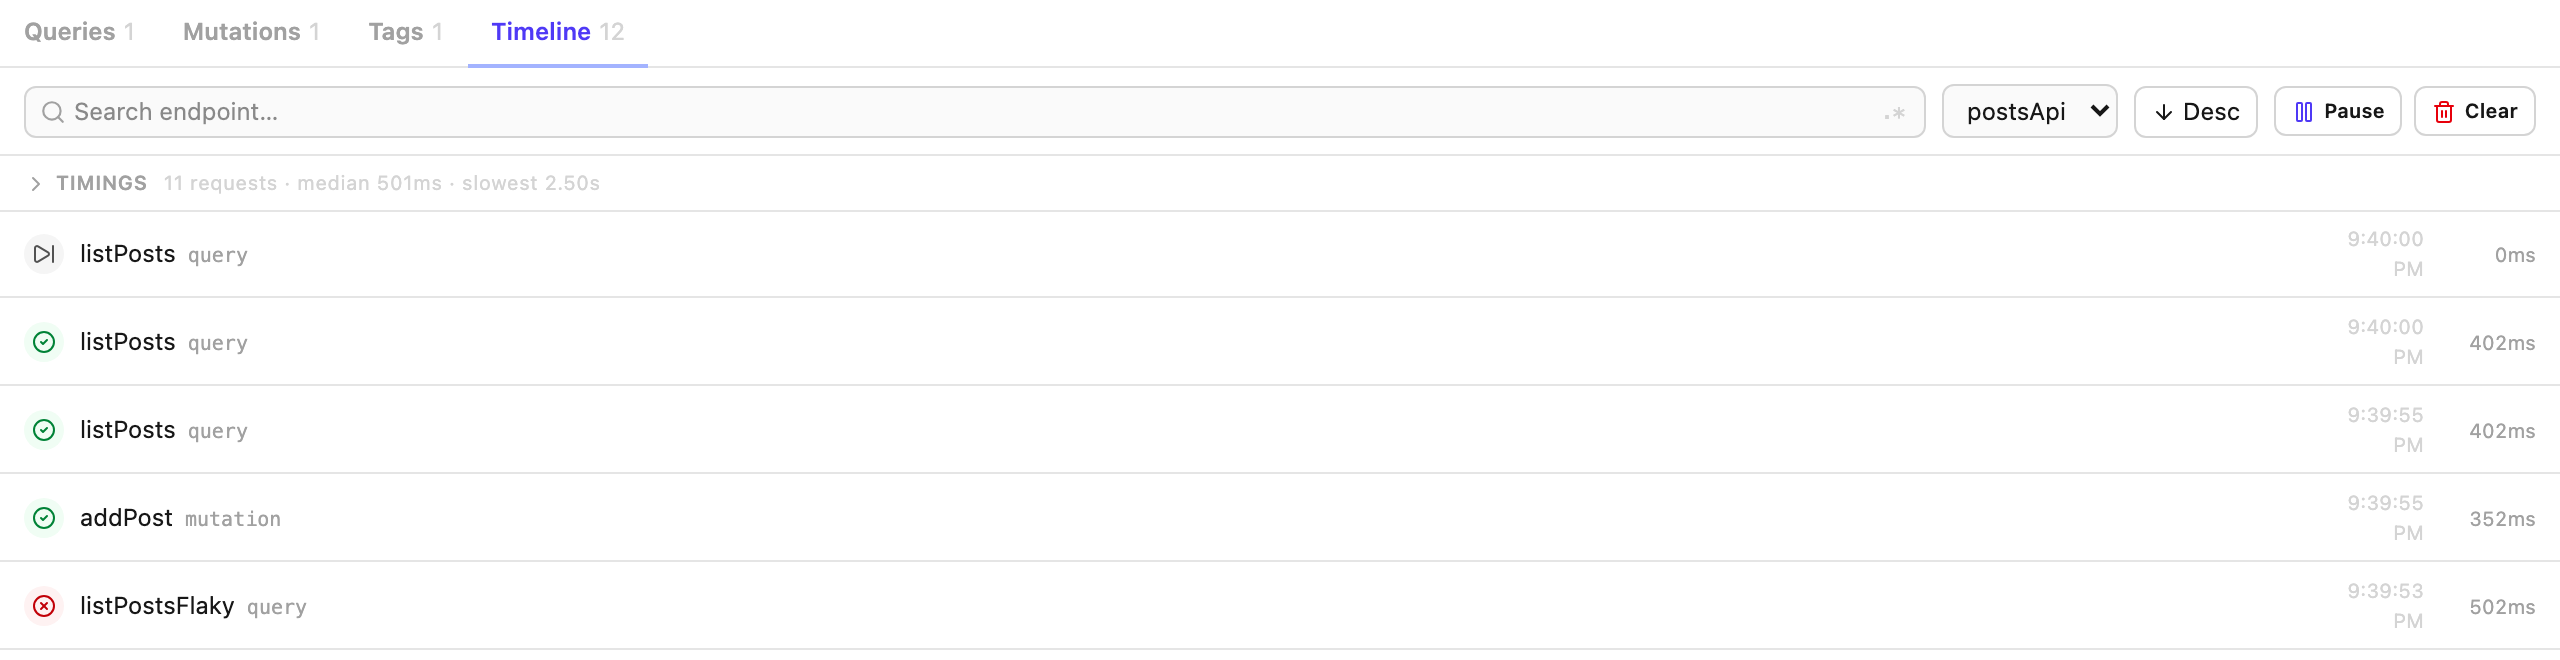
Per-endpoint timings
Fastest, median, average and slowest per endpoint, ordered slowest first, with error counts. Cache state can't tell you this, because it only holds the latest request's timestamps, so "which endpoint is slow, and how often does it fail?" is only answerable from the log. Skipped requests are excluded so they can't drag the numbers toward zero.
Poke at the things that are hard to reproduce
Network conditions and configuration that normally require changing your app.
Simulate offline and unfocused
Toggle offline or blur the tab without touching your network or your code. These dispatch RTK Query's own global actions, so
refetchOnReconnect and refetchOnFocus fire for real when you switch back. They aren't cosmetic flags.

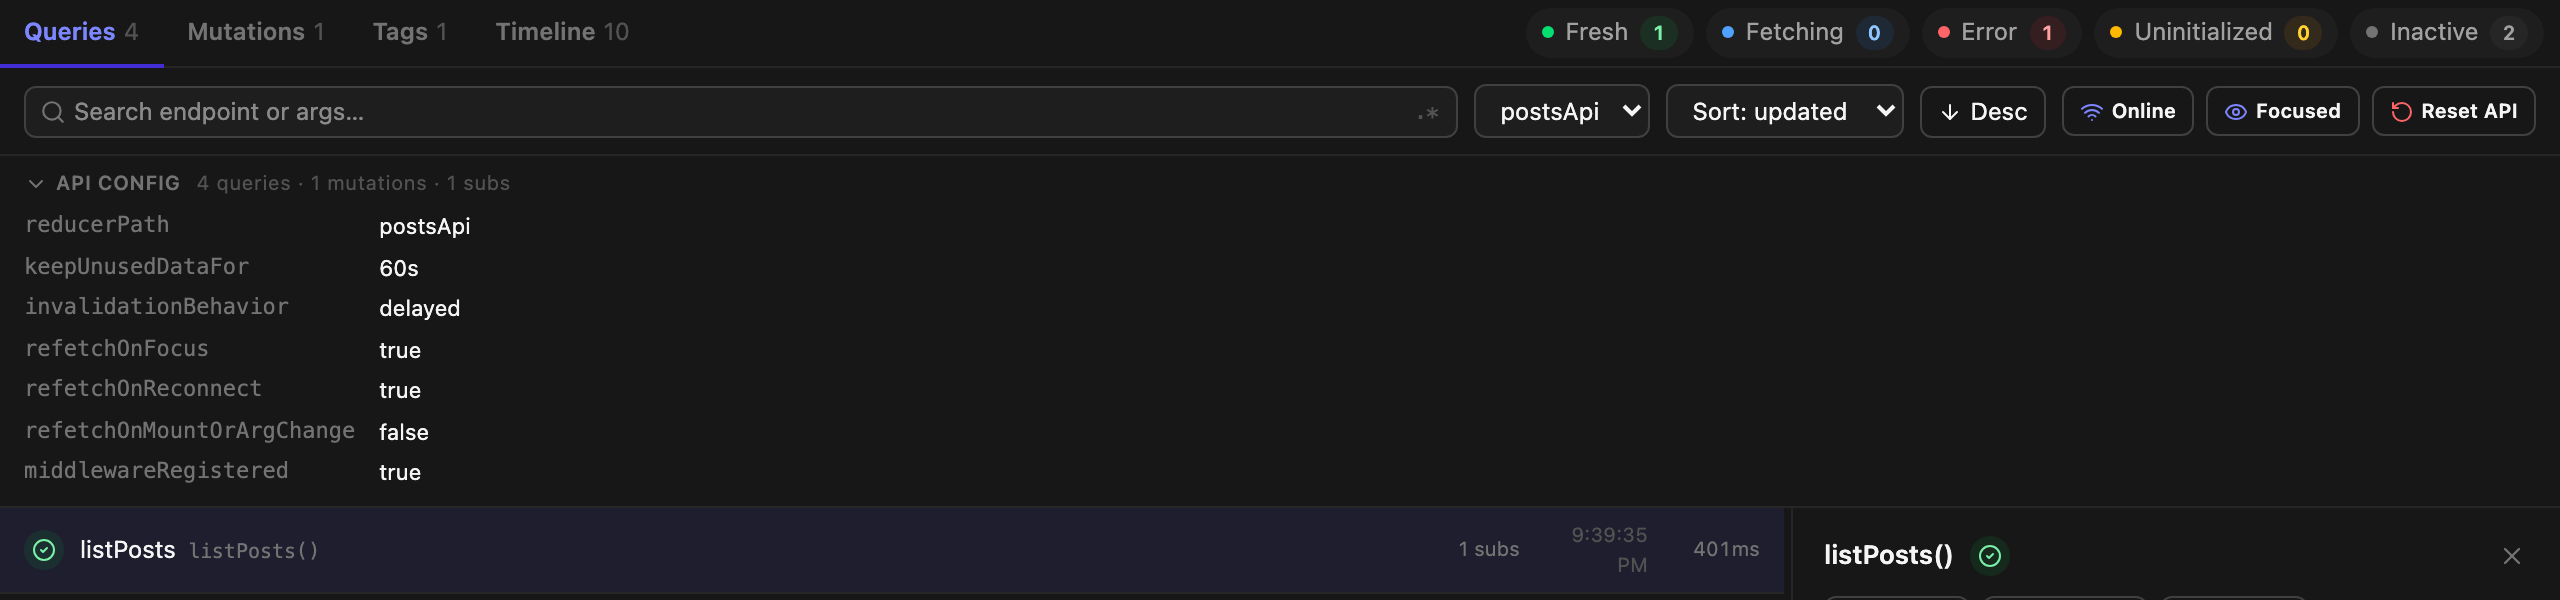
The config nobody surfaces
keepUnusedDataFor, invalidationBehavior, and the three refetchOn* flags, plus a count of cached queries, mutations and subscribers. These explain cache behaviour that otherwise looks arbitrary. Collapsed by default so it costs no space.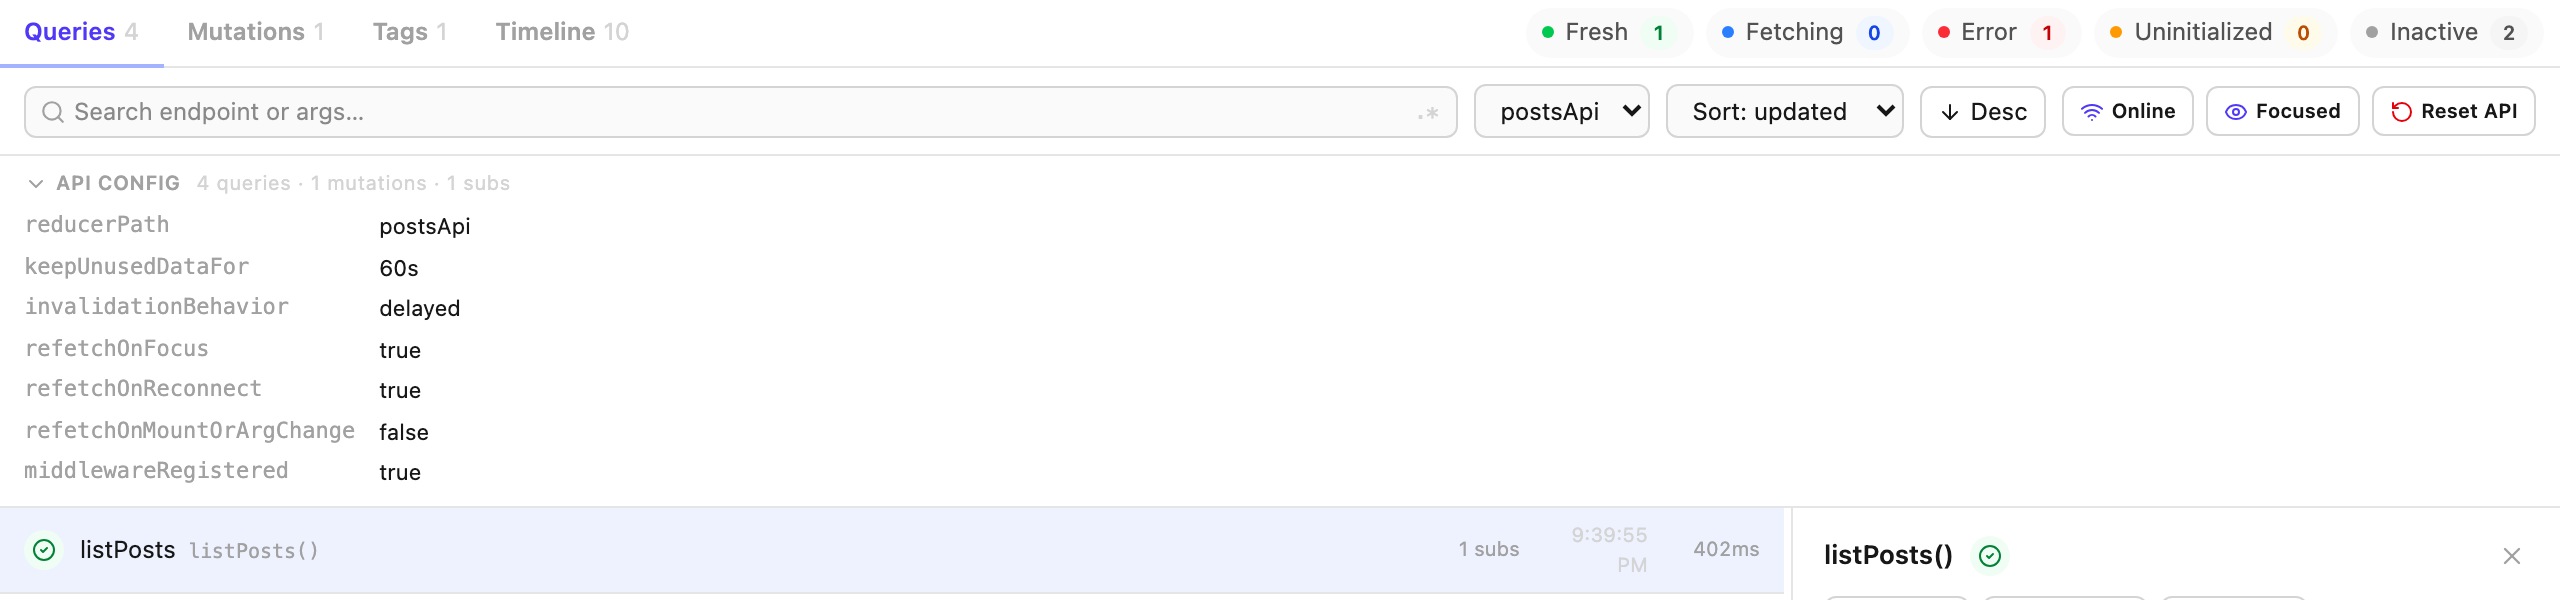
A warning for a bug you can't otherwise see
If RTK Query reports
middlewareRegistered: "conflict", meaning the same api's middleware registered twice, usually a duplicated module or bad HMR, the panel shows a persistent warning. Caching and invalidation misbehave silently in that state, and no other tool reports it.The parts you only notice when they're missing
Behaviour that matters once your cache is bigger than a demo.
Multiple APIs, discovered automatically
Every RTK Query api in your store is found by inspecting state, with no configuration. An api selector appears in each tab once there's more than one.
Virtualized lists
Queries, mutations and the timeline are all virtualized, so hundreds of cache entries stay responsive.
It remembers where you were
Active tab, filters, search terms, sort order and expanded sections persist across reloads, namespaced so they can't collide with your app's own storage.
Gone in production
Both the middleware and the plugin become no-ops when
process.env.NODE_ENV === "production", so bundlers drop the panel entirely. Leaving them wired into your store and app is safe.Light and dark, and keyboard-navigable
The panel follows the devtools shell's theme. Tabs are wired with proper roles and labelling, toggles expose their pressed state, and the data explorer is operable from the keyboard.
Works across RTK Query 2.x
Supports
@reduxjs/toolkit from 2.0.0 up, including the internal change in 2.6.2 that reshaped the tag index. It's handled transparently, so the panel doesn't care which side of that line you're on.